The events that never touch a browser, and are usually the ones that matter most.
What only your backend knows
A browser can tell you someone clicked Subscribe. Only your backend knows whether the payment cleared, whether the webhook was retried four times, whether the nightly export finished, and whether the subscription silently churned ninety days later.
Server-side events are also the trustworthy ones. They cannot be blocked by an extension, lost to a closed tab, or forged by a client. If a number needs to be correct rather than indicative, send it from your server.
There is no SDK to install. It is an HTTPS POST with a JSON body, and the batch limit of 1000 events per request means a job summarising a whole day costs a handful of calls.
Wiring a service to the portal
No library, no agent, no build change — the integration is a URL and two identifiers.
1
Create a site for the service
Add your ClickHouse module under Infralytiqs → Settings and give the service its own siteId — acme-etl, acme-checkout-api. Services usually deserve their own id rather than sharing the website’s, because their event vocabulary and their retention needs are different.
Settings
2
Post to the collector
POST {serverUrl}/il/analytics/{tenantId}/{siteId}/events with Content-Type: application/json and either a single object or an array of up to 1,000. There is no Authorization header — the registered tenant and site pair in the path is the authorisation, and an unregistered pair returns 403.
Set device_type to server and device_os to something meaningful for your runtime. It keeps backend traffic trivially separable from browser traffic in every report.
Contract
3
Decide what carries the identity
Server-side events have no browser to supply a session. Use user_id where you know the human, and put the job or correlation id in session_id where you do not — that is what lets you group every event from one pipeline run.
Design
4
Send the same correlation id to Loki
Put the job id into your logging MDC as well, and add it to the log line pattern. One identifier in both systems is what turns “this batch reported 14 failures” into “here are the 14 log lines”, and it costs one line of code.
Correlate
5
Verify, then chart it
A 201 with { success: true, count: N } means committed. Then build the panel: throughput per run, p95 duration, failure counts by reason. A scheduled job that has quietly processed nothing for three weeks looks exactly like a healthy one until it is on a chart.
Verify
What to instrument
Ordered roughly by how quickly each one earns its keep.
💳
Business transactions
Orders, subscriptions, refunds, plan changes. Emit these from the code that commits the transaction, so the event exists if and only if the thing actually happened.
🔗
Webhook traffic
Inbound webhooks from payment providers and partners, with the delivery attempt number and the outcome. The first thing you want when a partner claims they sent something.
⏰
Scheduled jobs
Start, finish, duration and records processed. A job that has silently done nothing for three weeks looks identical to a healthy one until you chart it.
🚨
Errors with context
Not a replacement for your error tracker, but errors as events let you group failures by customer, plan or region — the dimension an error tracker usually lacks.
🔐
Authentication and authorisation
Logins, failures, token refreshes, permission denials. A spike in denials is a product problem as often as a security one.
🤖
Machine consumers
API keys, integration partners and internal services. Whole classes of usage never appear in browser analytics at all.
Worked example: a Spring Boot ETL service
One service, both halves — analytics events to Infralytiqs, log streams to Loki, correlated by the same run id. This is the shape the AEM integrator uses, written out for an ordinary Spring application.
<!-- Nothing Infralytiqs-specific is required: the collector is plain
     JSON over HTTPS, so RestClient or WebClient is enough.

     Loki is the only added dependency. For a standalone Spring app the
     loki-logback-appender is the least intrusive route -- Logback
     pushes to /loki/api/v1/push directly and nothing in your code has
     to know about it. (Inside AEM you would instead deploy the
     aem-loki-integrator bundle, which is the OSGi equivalent.) -->

<dependencies>
  <dependency>
    <groupId>org.springframework.boot</groupId>
    <artifactId>spring-boot-starter-web</artifactId>
  </dependency>

  <dependency>
    <groupId>com.github.loki4j</groupId>
    <artifactId>loki-logback-appender</artifactId>
    <version>1.5.2</version>
  </dependency>
</dependencies>
infralytiqs:
  # The collector base URL and the two ids from your ClickHouse module
  # configuration in Settings. These three values are the entire
  # ingest contract -- there is no API key to rotate.
  server-url: https://api.infralytiqs.com
  tenant-id: acme
  site-id: acme-etl

  # Batch locally so a busy run makes a handful of calls rather than
  # thousands. The server's hard ceiling is 1000 events per request.
  batch-size: 500
  flush-interval-ms: 5000

loki:
  url: https://loki.acme.internal/loki/api/v1/push
  username: etl
  password: ${LOKI_PASSWORD}

  # Keep the label set small and bounded. app, environment and level
  # are the same three the AEM collector uses, which means one label
  # convention spans your whole estate and the console's label browser
  # behaves consistently wherever you point it.
  labels:
    app: acme-etl
    environment: ${DEPLOY_ENV:LOCAL}

spring:
  application:
    name: acme-etl
<configuration>
  <springProperty scope="context" name="lokiUrl"  source="loki.url"/>
  <springProperty scope="context" name="lokiUser" source="loki.username"/>
  <springProperty scope="context" name="lokiPass" source="loki.password"/>
  <springProperty scope="context" name="env"      source="loki.labels.environment"/>

  <appender name="LOKI" class="com.github.loki4j.logback.Loki4jAppender">
    <http>
      <url>${lokiUrl}</url>
      <auth>
        <username>${lokiUser}</username>
        <password>${lokiPass}</password>
      </auth>
    </http>

    <!-- Labels are the index. Anything unbounded -- run_id, asset
         path, user -- belongs in the message, never here. -->
    <format>
      <label>
        <pattern>app=acme-etl,environment=${env},level=%level</pattern>
      </label>

      <!-- run_id comes from the MDC and goes in the LINE, so it is
           greppable with |= but costs no cardinality. This is the
           single field that ties a log line back to the analytics
           events for the same pipeline run. -->
      <message>
        <pattern>[%X{run_id:-none}] %-5level %logger{36} | %msg%n</pattern>
      </message>
    </format>

    <batchMaxItems>500</batchMaxItems>
    <batchTimeoutMs>5000</batchTimeoutMs>
  </appender>

  <root level="INFO">
    <appender-ref ref="LOKI"/>
    <appender-ref ref="CONSOLE"/>
  </root>
</configuration>
package com.acme.etl.analytics;

import java.util.List;
import java.util.Map;
import java.util.concurrent.BlockingQueue;
import java.util.concurrent.LinkedBlockingQueue;

import org.slf4j.Logger;
import org.slf4j.LoggerFactory;
import org.springframework.scheduling.annotation.Scheduled;
import org.springframework.stereotype.Service;
import org.springframework.web.client.RestClient;

/**
 * Buffers events and posts them in batches.
 *
 * The two rules that matter: never let analytics block the pipeline,
 * and never let analytics fail the pipeline. Both are why this queues
 * rather than posting inline, and why the flush swallows its errors.
 */
@Service
public class InfralytiqsClient {

    private static final Logger LOG = LoggerFactory.getLogger(InfralytiqsClient.class);

    private final BlockingQueue<AnalyticsEvent> queue = new LinkedBlockingQueue<>(50_000);
    private final RestClient http;
    private final String endpoint;
    private final int batchSize;

    public InfralytiqsClient(InfralytiqsProperties props) {
        this.http = RestClient.create();
        this.batchSize = props.getBatchSize();
        this.endpoint = "%s/il/analytics/%s/%s/events".formatted(
                props.getServerUrl(), props.getTenantId(), props.getSiteId());
    }

    /** Non-blocking. Drops rather than waits if the buffer is full. */
    public void track(String eventType,
                      String subtype,
                      Map<String, String> dimensions,
                      Map<String, Double> metrics) {

        AnalyticsEvent event = new AnalyticsEvent();
        event.setEventType(eventType);
        event.setEventSubtype(subtype);
        event.setDeviceType("server");
        event.setDeviceOs("jvm");

        // The run id doubles as the session, so every event from one
        // pipeline run groups together -- and matches %X{run_id} in
        // the Loki line pattern.
        event.setSessionId(RunContext.currentRunId());
        event.setCustomDimensions(dimensions);
        event.setCustomMetrics(metrics);

        if (!queue.offer(event)) {
            LOG.warn("Analytics buffer full; dropped {} event", eventType);
        }
    }

    @Scheduled(fixedDelayString = "${infralytiqs.flush-interval-ms:5000}")
    public void flush() {
        List<AnalyticsEvent> batch = new java.util.ArrayList<>(batchSize);
        queue.drainTo(batch, batchSize);
        if (batch.isEmpty()) {
            return;
        }

        try {
            http.post()
                .uri(endpoint)
                .header("Content-Type", "application/json")
                .body(batch)
                .retrieve()
                .toBodilessEntity();

            LOG.debug("Posted {} analytics events", batch.size());
        } catch (Exception ex) {
            // Deliberately terminal. Re-queueing on a persistent
            // failure just fills the buffer and starts dropping the
            // events you actually wanted.
            LOG.warn("Analytics post failed, discarding {} events: {}",
                     batch.size(), ex.getMessage());
        }
    }
}
package com.acme.etl.pipeline;

import java.util.Map;
import org.slf4j.MDC;

@Component
public class AssetSyncJob {

    private static final Logger LOG = LoggerFactory.getLogger(AssetSyncJob.class);

    private final InfralytiqsClient analytics;
    private final AssetRepository repository;

    @Scheduled(cron = "0 0 2 * * *")
    public void run() {
        String runId = "sync-" + java.time.LocalDate.now() + "-" + shortId();

        // Set it once, at the top. Every log line emitted anywhere
        // beneath this -- including from libraries -- carries it, and
        // every analytics event picks it up as session_id.
        MDC.put("run_id", runId);
        RunContext.setRunId(runId);

        long started = System.currentTimeMillis();
        int ok = 0, failed = 0;

        try {
            LOG.info("Asset sync starting");

            analytics.track("etl_run", "etl_run_started",
                Map.of("pipeline", "asset_sync",
                       "trigger",  "schedule"),
                Map.of("run_signal", 1.0));

            for (Batch batch : repository.pendingBatches()) {
                long t0 = System.currentTimeMillis();
                try {
                    int rows = process(batch);
                    ok += rows;

                    LOG.info("Batch {} committed: {} rows in {} ms",
                             batch.id(), rows, System.currentTimeMillis() - t0);

                    // One event per batch, not per row. Dimensions are
                    // what you group by; metrics are what you add up.
                    analytics.track("etl_batch", "etl_batch_status_success",
                        Map.of("pipeline",    "asset_sync",
                               "source_system", batch.source(),
                               "batch_id",     batch.id()),
                        Map.of("rows_processed", (double) rows,
                               "batch_duration_ms",
                                   (double) (System.currentTimeMillis() - t0)));

                } catch (Exception ex) {
                    failed++;

                    // The log line carries the stack trace; the event
                    // carries the countable, groupable summary. Neither
                    // is trying to be the other.
                    LOG.error("Batch {} failed", batch.id(), ex);

                    analytics.track("etl_batch", "etl_batch_status_failed",
                        Map.of("pipeline",       "asset_sync",
                               "source_system",  batch.source(),
                               "batch_id",       batch.id(),
                               "failure_reason", ex.getClass().getSimpleName()),
                        Map.of("failure_signal", 1.0));
                }
            }

            LOG.info("Asset sync finished: {} rows, {} failed batches", ok, failed);

            analytics.track("etl_run", "etl_run_status_success",
                Map.of("pipeline", "asset_sync"),
                Map.of("rows_total",     (double) ok,
                       "batches_failed", (double) failed,
                       "run_duration_ms",
                           (double) (System.currentTimeMillis() - started)));

        } finally {
            MDC.remove("run_id");
            RunContext.clear();
        }
    }
}
The event vocabulary in the example
Small, deliberate and stable. Two event types carry the whole pipeline.
Event
Subtype
Dimensions
Metrics
etl_run
etl_run_started
pipeline, trigger
run_signal
etl_run
etl_run_status_success
pipeline
rows_total, batches_failed, run_duration_ms
etl_batch
etl_batch_status_success
pipeline, source_system, batch_id
rows_processed, batch_duration_ms
etl_batch
etl_batch_status_failed
pipeline, source_system, batch_id, failure_reason
failure_signal
Why the run id is the whole trick
The example above does one thing that is easy to skip and hard to retrofit: it puts the same run_id into the logging MDC and into session_id on every analytics event.
That single shared value is what makes the two systems one system. The report tells you that last night’s run committed 40,000 fewer rows than usual and that three batches failed with SocketTimeoutException. You copy the run id out of the drill-down, paste it into the Logs page as {app="acme-etl"} |= "sync-2026-07-27", and you are looking at the stack traces from exactly those three batches — not the whole night’s output.
Note the division of labour. Analytics events are small, structured and countable: an event per batch, with a reason as a dimension and a duration as a metric. Log lines are unstructured and verbose: the exception, the stack, the query that timed out. Trying to make either do the other’s job is the usual reason teams end up with expensive logging and useless dashboards.
The other half, in the console
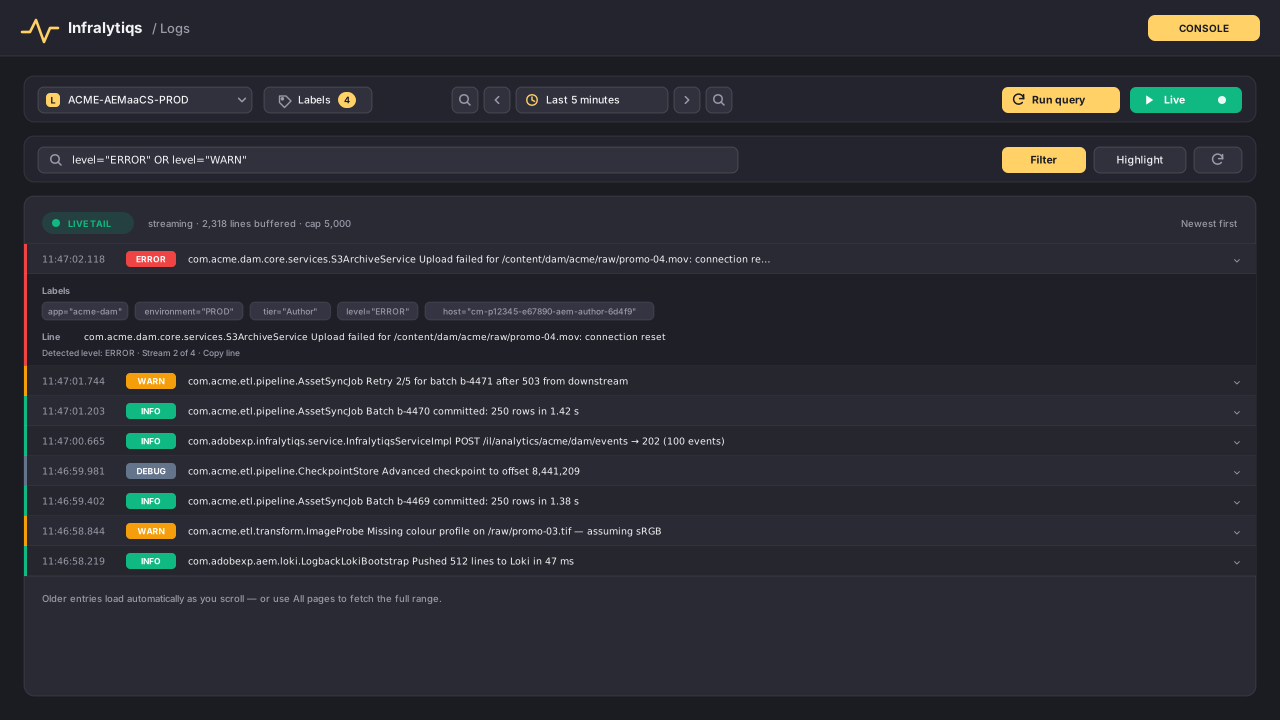
Log streams from the same service, filtered to the run that went wrong.
console.infralytiqs.com/#/infralytiqs/logs
Logs page
Live tail during a run
Expanding an entry shows its stream labels, so you can see which application and environment produced it. During a nightly run, live mode with a level filter is usually the fastest way to watch a pipeline behave.
Clients
Each one batches, retries with backoff and flushes on shutdown. The Node example is the fullest; the others are the same shape.
/**
 * Infralytiqs server-side client.
 *
 * Batches in memory, flushes on a timer, and drains on shutdown so an
 * in-flight batch is not lost on a rolling deploy.
 */
interface InfralytiqsEvent {
  event_type: string;
  event_subtype?: string;
  event_time?: string;
  user_id?: string;
  anonymous_id?: string;
  session_id?: string;
  page_url?: string;
  country_code?: string;
  device_type?: string;
  device_os?: string;
  utm_source?: string;
  language_iso_code?: string;
  custom_dimensions?: Record<string, string>;
  custom_metrics?: Record<string, number>;
}

interface Options {
  serverUrl: string;
  tenantId: string;
  siteId: string;
  /** Server hard limit is 1000. */
  batchSize?: number;
  flushIntervalMs?: number;
  globalDimensions?: Record<string, string>;
  onError?: (error: unknown, dropped: number) => void;
}

export class Infralytiqs {
  private readonly url: string;
  private readonly batchSize: number;
  private readonly globalDimensions: Record<string, string>;
  private readonly onError: (error: unknown, dropped: number) => void;
  private queue: InfralytiqsEvent[] = [];
  private timer?: NodeJS.Timeout;
  private flushing = false;

  constructor(private readonly options: Options) {
    this.url =
      `${options.serverUrl}/il/analytics/` +
      `${options.tenantId}/${encodeURIComponent(options.siteId)}/events`;
    this.batchSize = Math.min(options.batchSize ?? 100, 1000);
    this.globalDimensions = options.globalDimensions ?? {};
    this.onError = options.onError ?? (() => {});

    this.timer = setInterval(() => void this.flush(), options.flushIntervalMs ?? 5000);
    this.timer.unref?.();   // never hold the process open

    for (const signal of ['SIGTERM', 'SIGINT'] as const) {
      process.once(signal, () => void this.shutdown());
    }
  }

  track(event: InfralytiqsEvent): void {
    this.queue.push({
      // Stamp at capture. If the flush is delayed by a slow batch, the event
      // should still claim the moment it actually happened.
      event_time: new Date().toISOString(),
      ...event,
      custom_dimensions: { ...this.globalDimensions, ...event.custom_dimensions },
    });

    if (this.queue.length >= this.batchSize) {
      void this.flush();
    }
  }

  async flush(): Promise<void> {
    if (this.flushing || this.queue.length === 0) { return; }
    this.flushing = true;

    const batch = this.queue.splice(0, this.batchSize);

    try {
      await this.post(batch);
    } catch (error) {
      // Three attempts have already failed inside post(). Holding the batch
      // forever would grow the heap without bound, so drop it loudly.
      this.onError(error, batch.length);
    } finally {
      this.flushing = false;
    }
  }

  private async post(batch: InfralytiqsEvent[], attempt = 1): Promise<void> {
    const response = await fetch(this.url, {
      method: 'POST',
      headers: { 'Content-Type': 'application/json' },
      body: JSON.stringify(batch),
      signal: AbortSignal.timeout(10_000),
    });

    if (response.ok) { return; }

    // 4xx other than 429 will never succeed — a malformed payload or an
    // unknown tenant. Retrying is pointless and hides the real problem.
    if (response.status >= 400 && response.status < 500 && response.status !== 429) {
      throw new Error(
        `Infralytiqs rejected ${batch.length} events: ` +
        `${response.status} ${await response.text()}`
      );
    }

    if (attempt >= 3) {
      throw new Error(`Infralytiqs unavailable after ${attempt} attempts: ${response.status}`);
    }

    // Exponential backoff with jitter, so a fleet of instances does not
    // retry in lockstep after a shared outage.
    const delay = 2 ** attempt * 250 + Math.random() * 250;
    await new Promise((resolve) => setTimeout(resolve, delay));
    return this.post(batch, attempt + 1);
  }

  /** Drain everything. Call before the process exits. */
  async shutdown(): Promise<void> {
    if (this.timer) { clearInterval(this.timer); }
    while (this.queue.length > 0) { await this.flush(); }
  }
}

// ── Usage ──────────────────────────────────────────────────────────────
export const analytics = new Infralytiqs({
  serverUrl: process.env.IL_SERVER_URL!,
  tenantId:  process.env.IL_TENANT_ID!,
  siteId:    process.env.IL_SITE_ID!,
  globalDimensions: {
    service:     'checkout-api',
    environment: process.env.NODE_ENV ?? 'development',
    release:     process.env.GIT_SHA ?? 'unknown',
  },
  onError: (error, dropped) =>
    logger.warn({ err: error, dropped }, 'infralytiqs batch dropped'),
});

// Emit from the code that commits the transaction, so the event exists if
// and only if the order does.
await db.transaction(async (tx) => {
  const order = await tx.orders.create(payload);

  analytics.track({
    event_type: 'order_completed',
    user_id: order.customerId,
    custom_dimensions: {
      order_id: order.id,
      plan:     order.plan,
      currency: order.currency,
      country_code: order.billingCountry,
    },
    custom_metrics: {
      order_value: order.total,
      item_count:  order.items.length,
    },
  });
});
"""Infralytiqs server-side client.

Thread-safe, batches in memory, flushes on a background timer and drains
at interpreter exit.
"""

from __future__ import annotations

import atexit
import json
import logging
import random
import threading
import time
import urllib.error
import urllib.request
from datetime import datetime, timezone
from typing import Any

LOG = logging.getLogger(__name__)
MAX_BATCH = 1000  # server hard limit


class Infralytiqs:
    def __init__(
        self,
        server_url: str,
        tenant_id: str,
        site_id: str,
        batch_size: int = 100,
        flush_interval_s: float = 5.0,
        global_dimensions: dict[str, str] | None = None,
    ) -> None:
        self._url = f"{server_url}/il/analytics/{tenant_id}/{site_id}/events"
        self._batch_size = min(batch_size, MAX_BATCH)
        self._global_dimensions = global_dimensions or {}
        self._queue: list[dict[str, Any]] = []
        self._lock = threading.Lock()
        self._stopping = threading.Event()

        self._worker = threading.Thread(
            target=self._run, name="infralytiqs-flush", daemon=True
        )
        self._worker.start()
        self._flush_interval_s = flush_interval_s

        atexit.register(self.shutdown)

    def track(
        self,
        event_type: str,
        *,
        user_id: str | None = None,
        subtype: str | None = None,
        dimensions: dict[str, str] | None = None,
        metrics: dict[str, float] | None = None,
        event_time: datetime | None = None,
    ) -> None:
        event: dict[str, Any] = {
            "event_type": event_type,
            # Stamped at capture, so a delayed flush does not shift the event.
            "event_time": (event_time or datetime.now(timezone.utc))
            .isoformat(timespec="milliseconds")
            .replace("+00:00", "Z"),
            "custom_dimensions": {**self._global_dimensions, **(dimensions or {})},
            "custom_metrics": metrics or {},
        }
        if user_id:
            event["user_id"] = user_id
        if subtype:
            event["event_subtype"] = subtype

        with self._lock:
            self._queue.append(event)
            should_flush = len(self._queue) >= self._batch_size

        if should_flush:
            self.flush()

    def flush(self) -> None:
        with self._lock:
            if not self._queue:
                return
            batch = self._queue[: self._batch_size]
            del self._queue[: len(batch)]

        try:
            self._post(batch)
        except Exception:
            # Already retried inside _post. Re-queueing indefinitely would
            # grow memory without bound, so drop the batch and say so.
            LOG.warning("infralytiqs: dropped %d events", len(batch), exc_info=True)

    def _post(self, batch: list[dict[str, Any]], attempt: int = 1) -> None:
        request = urllib.request.Request(
            self._url,
            data=json.dumps(batch).encode("utf-8"),
            headers={"Content-Type": "application/json"},
            method="POST",
        )
        try:
            with urllib.request.urlopen(request, timeout=10) as response:
                if 200 <= response.status < 300:
                    return
        except urllib.error.HTTPError as error:
            # 4xx other than 429 will never be accepted; retrying hides it.
            if 400 <= error.code < 500 and error.code != 429:
                raise RuntimeError(
                    f"infralytiqs rejected {len(batch)} events: "
                    f"{error.code} {error.read().decode('utf-8', 'replace')}"
                ) from error
        except (urllib.error.URLError, TimeoutError):
            pass

        if attempt >= 3:
            raise RuntimeError(f"infralytiqs unavailable after {attempt} attempts")

        # Jittered backoff so a fleet does not retry in lockstep.
        time.sleep(2**attempt * 0.25 + random.random() * 0.25)
        self._post(batch, attempt + 1)

    def _run(self) -> None:
        while not self._stopping.wait(self._flush_interval_s):
            self.flush()

    def shutdown(self) -> None:
        self._stopping.set()
        while True:
            with self._lock:
                if not self._queue:
                    break
            self.flush()


# ── Usage ──────────────────────────────────────────────────────────────
analytics = Infralytiqs(
    server_url=os.environ["IL_SERVER_URL"],
    tenant_id=os.environ["IL_TENANT_ID"],
    site_id=os.environ["IL_SITE_ID"],
    global_dimensions={
        "service": "ingest-worker",
        "environment": os.environ.get("ENV", "development"),
    },
)

analytics.track(
    "document_processed",
    user_id=job.owner_id,
    subtype="document_processed_status_success",
    dimensions={"document_type": job.kind, "pipeline": "ocr-v3"},
    metrics={"duration_ms": elapsed_ms, "page_count": job.pages},
)
package com.acme.analytics;

import java.net.URI;
import java.net.http.HttpClient;
import java.net.http.HttpRequest;
import java.net.http.HttpResponse;
import java.time.Duration;
import java.time.Instant;
import java.util.ArrayList;
import java.util.List;
import java.util.Map;
import java.util.concurrent.*;

import com.fasterxml.jackson.databind.ObjectMapper;

/**
 * Infralytiqs server-side client. Batches on a bounded queue, flushes on a
 * scheduler, and drains on shutdown.
 */
public final class Infralytiqs implements AutoCloseable {

    private static final int MAX_BATCH = 1000;   // server hard limit

    private final HttpClient http = HttpClient.newBuilder()
            .connectTimeout(Duration.ofSeconds(5))
            .build();
    private final ObjectMapper mapper = new ObjectMapper();
    private final ScheduledExecutorService scheduler =
            Executors.newSingleThreadScheduledExecutor(r -> {
                Thread t = new Thread(r, "infralytiqs-flush");
                t.setDaemon(true);
                return t;
            });

    private final URI endpoint;
    private final int batchSize;
    private final Map<String, String> globalDimensions;

    // Bounded, so a collector outage cannot exhaust the heap.
    private final BlockingQueue<Map<String, Object>> queue =
            new LinkedBlockingQueue<>(50_000);

    public Infralytiqs(String serverUrl, String tenantId, String siteId,
                       int batchSize, Map<String, String> globalDimensions) {
        this.endpoint = URI.create(
                serverUrl + "/il/analytics/" + tenantId + "/" + siteId + "/events");
        this.batchSize = Math.min(batchSize, MAX_BATCH);
        this.globalDimensions = Map.copyOf(globalDimensions);

        scheduler.scheduleAtFixedRate(this::flush, 5, 5, TimeUnit.SECONDS);
    }

    public void track(String eventType,
                      String userId,
                      String subtype,
                      Map<String, String> dimensions,
                      Map<String, Double> metrics) {

        Map<String, Object> event = new java.util.HashMap<>();
        event.put("event_type", eventType);
        // Stamped now rather than at flush time.
        event.put("event_time", Instant.now().toString());

        Map<String, String> merged = new java.util.HashMap<>(globalDimensions);
        if (dimensions != null) {
            merged.putAll(dimensions);
        }
        event.put("custom_dimensions", merged);
        event.put("custom_metrics", metrics == null ? Map.of() : metrics);

        if (userId != null)  { event.put("user_id", userId); }
        if (subtype != null) { event.put("event_subtype", subtype); }

        // offer, not put: never block application code on analytics.
        if (!queue.offer(event)) {
            LOG.warn("infralytiqs: queue full, dropping {}", eventType);
        }
    }

    public void flush() {
        List<Map<String, Object>> batch = new ArrayList<>(batchSize);
        queue.drainTo(batch, batchSize);
        if (batch.isEmpty()) {
            return;
        }

        try {
            HttpRequest request = HttpRequest.newBuilder(endpoint)
                    .header("Content-Type", "application/json")
                    .timeout(Duration.ofSeconds(10))
                    .POST(HttpRequest.BodyPublishers.ofString(
                            mapper.writeValueAsString(batch)))
                    .build();

            HttpResponse<String> response =
                    http.send(request, HttpResponse.BodyHandlers.ofString());

            if (response.statusCode() / 100 != 2) {
                LOG.warn("infralytiqs: {} rejected {} events: {}",
                        response.statusCode(), batch.size(), response.body());
            }
        } catch (Exception e) {
            LOG.warn("infralytiqs: dropped {} events", batch.size(), e);
        }
    }

    @Override
    public void close() {
        scheduler.shutdown();
        while (!queue.isEmpty()) {
            flush();
        }
    }

    private static final org.slf4j.Logger LOG =
            org.slf4j.LoggerFactory.getLogger(Infralytiqs.class);
}
#!/usr/bin/env bash
# Instrument a scheduled job with nothing but curl and jq.
#
# The value here is not the event itself — it is that a job which has
# silently done nothing for three weeks looks exactly like a healthy one
# until you chart duration and record count.
set -euo pipefail

IL_SERVER_URL="${IL_SERVER_URL:?}"
IL_TENANT_ID="${IL_TENANT_ID:?}"
IL_SITE_ID="${IL_SITE_ID:?}"
IL_ENDPOINT="${IL_SERVER_URL}/il/analytics/${IL_TENANT_ID}/${IL_SITE_ID}/events"

emit() {
  local event_type="$1" subtype="$2" duration_ms="$3" records="$4"

  jq -n \
    --arg  type     "$event_type" \
    --arg  subtype  "$subtype" \
    --arg  time     "$(date -u +%Y-%m-%dT%H:%M:%S.000Z)" \
    --arg  host     "$(hostname -s)" \
    --arg  job      "${JOB_NAME:-nightly-export}" \
    --argjson duration "$duration_ms" \
    --argjson records  "$records" \
    '{
       event_type:    $type,
       event_subtype: $subtype,
       event_time:    $time,
       custom_dimensions: { job: $job, host: $host, runner: "cron" },
       custom_metrics:    { duration_ms: $duration, record_count: $records }
     }' \
  | curl -sS --max-time 10 -X POST "$IL_ENDPOINT" \
      -H 'Content-Type: application/json' \
      --data-binary @- >/dev/null \
  || echo "infralytiqs: emit failed for $event_type" >&2
  # Analytics must never fail the job it is measuring, hence the || above.
}

started=$(date +%s%3N)
emit job_run started 0 0

# ── the actual work ──────────────────────────────────────────────────
if records=$(/usr/local/bin/nightly-export --count-only); then
  status=job_run_status_success
else
  status=job_run_status_failed
  records=0
fi

emit job_run "$status" "$(( $(date +%s%3N) - started ))" "${records:-0}"
Backfilling history
Because event_time is a field you control, importing your existing history is just a batched loop.
"""Backfill historical events from your own database.

event_time is settable, so history is not a special case — it is the same
endpoint with older timestamps.

Before you start: the table ships with TTL event_date + INTERVAL 24 MONTH,
so anything older than that will be dropped at the next merge. Extend the
TTL first if you are importing further back:

    ALTER TABLE website_events
        MODIFY TTL event_date + INTERVAL 120 MONTH DELETE;
"""

import itertools
from datetime import timezone

BATCH = 1000  # server hard limit


def batched(iterable, size):
    iterator = iter(iterable)
    while chunk := list(itertools.islice(iterator, size)):
        yield chunk


def to_event(row):
    return {
        "event_type": "order_completed",
        "event_time": row.created_at.astimezone(timezone.utc)
        .isoformat(timespec="milliseconds")
        .replace("+00:00", "Z"),
        "user_id": str(row.customer_id),
        "country_code": row.billing_country,
        "custom_dimensions": {
            "order_id": str(row.id),
            "plan": row.plan,
            "currency": row.currency,
            "backfill": "true",          # so you can tell imported from live
        },
        "custom_metrics": {
            "order_value": float(row.total),
            "item_count": row.item_count,
        },
    }


rows = db.query(
    "SELECT * FROM orders WHERE created_at >= %s ORDER BY created_at",
    (start_date,),
)

sent = 0
for chunk in batched(rows, BATCH):
    events = [to_event(row) for row in chunk]

    # Send synchronously and stop on failure. A partial backfill you know
    # the boundary of is recoverable; one you do not is not.
    response = requests.post(ENDPOINT, json=events, timeout=30)
    response.raise_for_status()

    sent += response.json()["count"]
    print(f"backfilled {sent} events, through {chunk[-1].created_at}")

print(f"done: {sent} events")

# Verify against your own ClickHouse, and confirm the partitions you expect
# actually exist:
#
#   SELECT toYYYYMM(event_date) AS month, count() AS events
#   FROM website_events
#   WHERE custom_dimensions['backfill'] = 'true'
#   GROUP BY month ORDER BY month;
-- The ingest endpoint does not deduplicate: event_id defaults to
-- generateUUIDv4(), so re-running a backfill inserts everything twice.
-- Check before and after rather than hoping.

-- 1. Before: is there anything already in this window?
SELECT
    toDate(event_time) AS day,
    count()            AS events
FROM website_events
WHERE event_type = 'order_completed'
  AND event_date BETWEEN '2024-01-01' AND '2024-12-31'
GROUP BY day
ORDER BY day;

-- 2. After: does the count match your source system exactly?
SELECT count() AS imported
FROM website_events
WHERE custom_dimensions['backfill'] = 'true'
  AND event_type = 'order_completed';

-- 3. If you did double-import, the backfill dimension makes it recoverable.
--    ALTER DELETE is a mutation — heavy, but this is a one-off.
ALTER TABLE website_events
DELETE WHERE custom_dimensions['backfill'] = 'true'
  AND event_type = 'order_completed';

-- 4. Better still, make the import idempotent by deriving a deterministic
--    event_id from your own primary key, so a re-run overwrites rather than
--    duplicates. Send event_id explicitly:
--      event_id = UUIDNumToString(MD5(concat('order:', order_id)))
--    then deduplicate at read time with argMax, or use a
--    ReplacingMergeTree copy of the table for this event type.
Server-side questions
No, and every client on this page is built that way — bounded queues, non-blocking enqueue, and dropping with a log line when the queue is full. An outage in your analytics pipeline must never become an outage in your product.
Pass the anonymous_id or session_id from the browser through to your backend — a header on the API call is the usual route — and include it on the server-side event. Then a funnel from click to confirmed payment is one query. Without it, user_id is your join key, which only works after login.
No. event_id defaults to a fresh UUID, so a retried batch inserts duplicates. If exactly-once matters, send a deterministic event_id derived from your own primary key and deduplicate at read time with argMax, or keep that event type in a ReplacingMergeTree table.
One per process, with a global dimension naming the service. That gives each process its own queue and flush timer while letting you group or filter by service in reports. Sharing a client across processes is not possible anyway, since the queue is in memory.
Batching does not help you there. Send synchronously before the handler returns, and accept the added latency — or write events to a queue your own infrastructure owns and forward them from a long-lived consumer, which is usually the better shape.
You can, and you should think carefully first. It is your database, so this is your policy decision rather than ours — but the table keeps rows for 24 months by default, and Map columns are awkward to selectively redact. Sending an opaque id and joining to your own user table at query time is almost always the better choice.
Now run the database properly
The ClickHouse guide covers a production setup: least-privilege users, TLS, retention, backups and what actually breaks.