0
Events per ingest request
Batch limit on a single ingest call


Track every event from your websites, mobile apps and server-side services into a ClickHouse database you own. No sampling, no event caps, and retention you set yourself.
What the platform gives you by default — not a sampled subset, and not a number that changes with your bill.
0
Events per ingest request
Batch limit on a single ingest call
0
Default retention
Months of raw events kept before the default TTL expires
0
Visualisation types
Chart types you can build a report panel from
0
Events sampled away
Every event stored, every event counted
One ingestion contract, one database, one console — across every surface your product runs on.
From a click in a browser to a chart in the console, in four hops.
Sources
JavaScript SDK
Auto page viewsiOS · Android · RN
Offline batchingNode · Java · Python
REST APIAuthor & publish
Assets · PagesIngest
HTTPS endpoint
Write key authSchema & enrichment
Geo · device · UAStore
Async insert
Backpressure safeMergeTree tables
Yours to ownReport
Aggregate SQL
Sub-secondReports & dashboards
Or your own SQLEvery surface speaks the same HTTP contract. The collector validates and batches, ClickHouse stores and aggregates, and the console queries it — all inside infrastructure you control.
These are live renderings of the panel types in the console, drawn from sample data.
Page views against unique visitors, day by day. Hover any point in the console to break the day down by hour.
ClickHouse response times for the console's own aggregate queries, measured across 90 days of raw events.
Device mix across all sessions. The console splits this further by operating system and browser version.
Top pages by views for the period. Each row drills through to that page's own engagement report.
How your ClickHouse disk is spent. Compression means raw event volume rarely translates into the storage bill you expect.
Share of accepted events against total received. Rejections are almost always schema violations, and the console lists them individually.
Everything on one screen, in the theme you prefer.
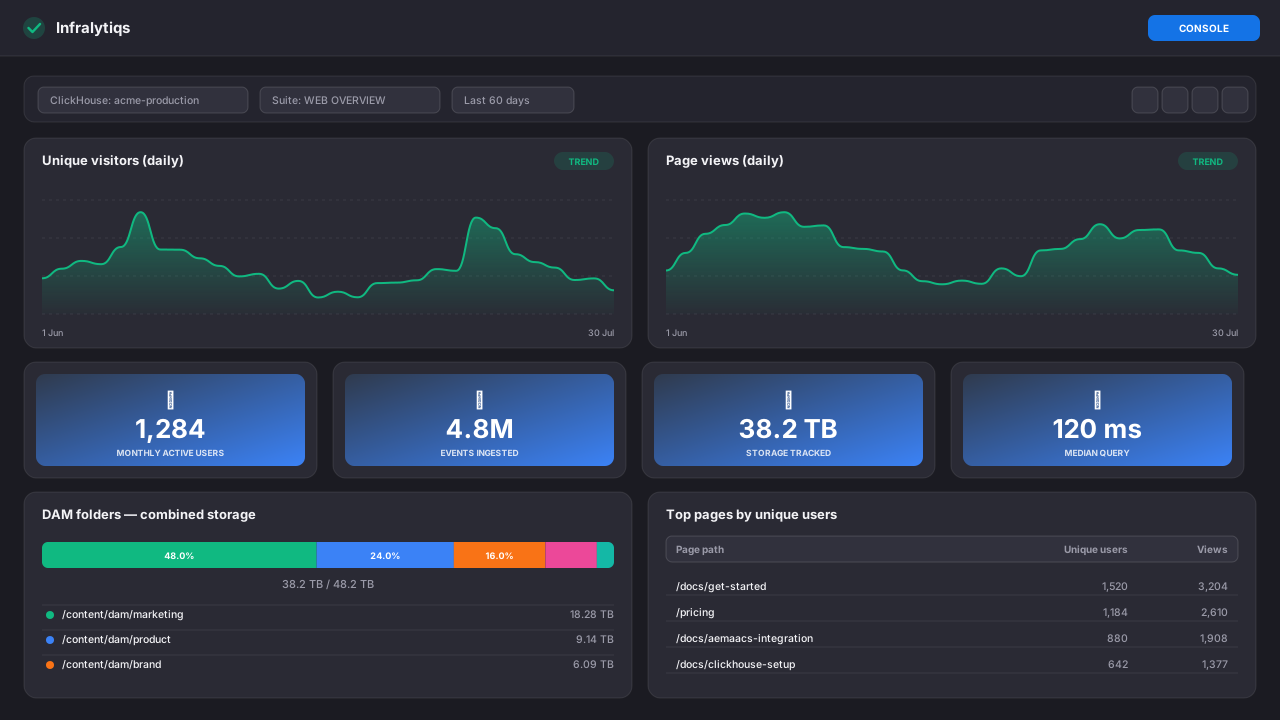
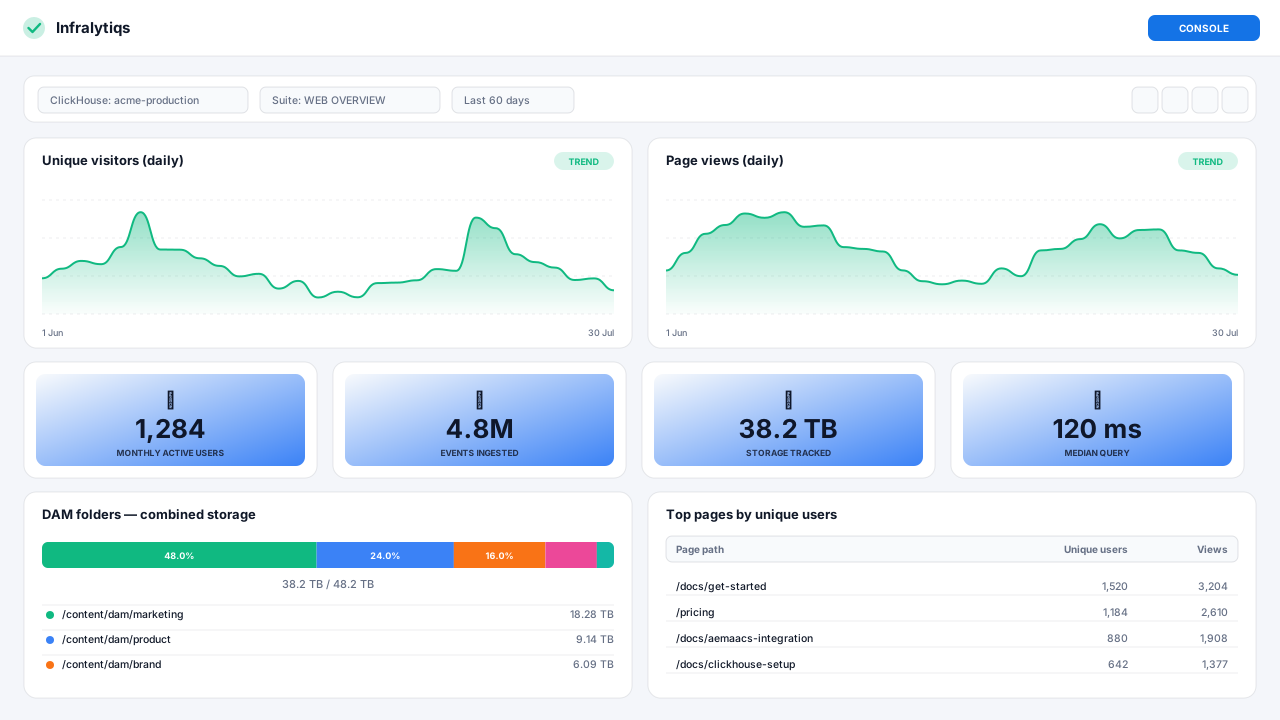
Traffic trends, device mix, top pages, latency percentiles and storage growth — each one a saved panel built in the report builder. Switch the site theme and the console follows.
Sign in with SSO, create a tenant, paste the snippet. Your first events show up in the console within seconds — and no credit card is involved.