Why AEM needs both halves

Web analytics tells you what happened on the published site. It tells you nothing about the authoring side — who uploaded the 400 MB TIFF that nobody ever used, which assets get downloaded and by whom, whether a share link was actually opened, or why your DAM grew 12% last month.

Infralytiqs instruments both. The published site uses the same browser SDK as any other website. The author environment uses an OSGi bundle that observes replication events and request traffic, then batches events to the collector using the same ingest contract. Both land in the same website_events table in your ClickHouse, so an asset's authoring history and its published-page performance are one query apart.

What gets instrumented where

One bundle on author, one script on publish, one table in your database.

AEM Author

OSGi bundle

Filters + listener

aem-infralytiqs-integrator

Asset events

Upload · download · share

Sling filters

Replication

Activate · deactivate

Event listener

Scheduler

DAM disk usage

Quartz cron

AEM Publish

Page HTL

Renders IL_* globals

Infralytiqs.html

Browser SDK

Auto page views + clicks

infralytiqs.min.js

Bootstrap JS

Site-specific hooks

Your file

Collector

Ingest

Batched, up to 1000

tenant + site in URL

Tenant resolve

By content root path

TenantServiceManager

Your ClickHouse

website_events

Author and publish rows

One table

Reports

DAM quotas · traffic

Console

The author-side bundle never talks to the browser and the publish-side SDK never talks to AEM internals. They meet in your ClickHouse table.

Part one — the published site

The published side is ordinary website tracking, with one AEM-specific wrinkle: the tenant and site identifiers must come from OSGi configuration rather than being hard-coded into a clientlib, because the same codebase serves several content roots and hostnames.

The bundle solves this with a factory configuration per content root. An HTL fragment asks the TenantService for the tuple matching the current page's path and renders it as page globals; the SDK reads those globals and loads your bootstrap script. Adding a brand means adding a factory configuration, not editing code.

The published-site wiring

Three files: an HTL fragment that renders the configuration, the bootstrap script that initialises the SDK, and the Sling model that resolves the tenant.

<!--/*
    apps/<yourproject>/components/structure/page/partials/Infralytiqs.html

    Renders the Infralytiqs page globals and loads the SDK. Include this from
    your page component's customfooterlibs.html so it runs after the DOM is
    parsed. The tuple comes from the TenantService factory configuration whose
    rootPath matches the current page, so nothing here is brand-specific.
*/-->
<sly data-sly-use.il="com.yourproject.core.models.InfralytiqsBootstrapModel"/>

<sly data-sly-test="${il.enabled &amp;&amp; !wcmmode.edit &amp;&amp; !wcmmode.preview}">
    <script>
        window.IL_SERVER_URL          = "${il.analyticsServerUrl @ context='scriptString'}";
        window.IL_TENANT_ID           = "${il.tenantId @ context='scriptString'}";
        window.IL_SITE_ID             = "${il.siteId @ context='scriptString'}";
        window.IL_DB_NAME             = "${il.dbName @ context='scriptString'}";
        window.IL_CLIENT_BOOTSTRAP_LIB = "${il.clientBootstrapLib @ context='scriptString'}";
    </script>

    <!--/*
        The SDK reads IL_CLIENT_BOOTSTRAP_LIB on load and injects your bootstrap
        script itself, resolving the path against its own CDN origin. So there is
        no second script tag to maintain here.
    */-->
    <script src="https://assets.infralytiqs.com/v1/scripts/infralytiqs.min.js"
            async
            crossorigin="anonymous"></script>
</sly>

Part two — the author environment

This is the half you cannot get from a tag manager. The bundle registers Sling filters, a replication event listener and a scheduled job, each independently configurable and each emitting a distinct event_type.

Events are queued in memory and posted in batches — 100 per request by default, flushed every 2.5 seconds, with a 50,000-event backlog. That matters on author, because analytics must never add latency to an author's request or block a replication. When the backlog is full, events are dropped and logged rather than applying backpressure to AEM.

Author-side event types

What each component emits into your website_events table. Every row carries the acting user, resolved to a display name and email when profile enrichment is on.

Event type Emitted by Trigger Notable dimensions
asset_upload Upload Tracking Filter An asset is created or a binary replaced through the DAM UI or HTTP API Asset path, format, size, acting user
asset_download Download Tracking Filter An original or rendition is downloaded from author Asset path, rendition, format, acting user
asset_share Share Link Access Tracking Filter A share link is opened, not merely created Asset path, subtype carrying the HTTP status, e.g. share_link_view_status_200
asset_publish Asset Publish Event Listener A replication ACTIVATE or DEACTIVATE completes Subtype asset_publish_status_success, metric asset_publish_count, one row per asset path in the payload
asset_disk_usage_report DAM Disk Usage Report Scheduler On a cron schedule, not on user activity Folder path, bytes consumed, rendition breakdown — this is what feeds the storage quota panels
authentication_success Authentication Tracking Filter A configured login endpoint returns success User id, groups, method. The event type is configurable per rule
logout Authentication Tracking Filter A rule declares event_type=logout for a logout endpoint Same shape as the above, routed to a distinct event type

The OSGi configuration

Everything is a run-mode configuration file under ui.config/src/main/content/jcr_root/apps/<project>/osgiconfig/. The tenant factory is the one you must have; the rest tune what gets captured.

// config.author/com.adobexp.infralytiqs.service.impl.TenantServiceImpl~acme.cfg.json
//
// One file per content root. The ~acme suffix is the factory instance name and
// can be anything; add a second file for a second brand. Events whose content
// path matches no factory configuration are DROPPED, which is the intended
// failure mode: no silent misattribution.
{
  "rootPath": "/content/acme",
  "tenantId": "acme",
  "siteId": "acme-www",
  "dbName": "acme_analytics",
  "analyticsServerUrl": "https://api.infralytiqs.com",

  // Needed only for read access — minting a JWT at POST /il/token so embedded
  // report widgets can query. Ingest itself needs no credentials.
  "companyId": "665f1c9e4a2b3d0012ab34cd",
  "clientKey": "3f9a1c7d5e2b8064af31c9d2",
  "clientSecret": "$[secret:acme_infralytiqs_client_secret]",

  // host:path — the matching path becomes window.IL_CLIENT_BOOTSTRAP_LIB and
  // the SDK loads it from its own CDN origin.
  "infralytiqsClientBootstrapLibs": [
    "www.acme.com:/etc.clientlibs/acme/clientlibs/infralytiqs/bootstrap.js",
    "shop.acme.com:/etc.clientlibs/acme/clientlibs/infralytiqs/bootstrap-shop.js"
  ]
}

Installing it

Assumes you already have a tenant and a connected ClickHouse server. If not, work through the getting-started guide first.

  1. Add the bundle to your build

    Add aem-infralytiqs-integrator's all package as a dependency and an embed in your own all package, so it deploys as part of your normal Cloud Manager pipeline rather than as a manual package install.

    Confirm it landed by checking that the bundle is Active in the OSGi console — a bundle stuck in Installed means an unsatisfied import, and no events will flow.

    Cloud Manager
  2. Create a tenant factory configuration

    Add the TenantServiceImpl~<name>.cfg.json file shown above under ui.config/.../osgiconfig/config.author/. The rootPath is matched against each event's content path, and an event whose path matches nothing is dropped.

    Put clientSecret in Cloud Manager as a secret environment variable and reference it as $[secret:name]. Never commit it.

    One per content root
  3. Map the enrichment system user

    Profile enrichment resolves the acting user's display name and email from JCR, which needs a service user mapping for the user-enrichment sub-service with read access to /home/users.

    Skip it if you would rather not put author identities in the event stream — set userEnrichmentEnabled to false and events still carry the opaque user id.

    Only if you want author names
  4. Enable the filters you want

    Each filter, the listener and the scheduler are separately configurable and each has its own enabled flag. Start with the asset publish listener and the upload and download filters, which give immediate value and cost almost nothing.

    Add the DAM disk usage scheduler once you have a week of data worth trending, and the authentication filter last, since its rules need to match your actual login endpoints.

    Opt in per capability
  5. Wire the published site

    Add the Sling model and the Infralytiqs.html fragment, include it from customfooterlibs.html, and deploy your bootstrap script as a clientlib. Then reference that clientlib path from infralytiqsClientBootstrapLibs, keyed by host.

    Check it with ?ilDebug=1 on a published page: the SDK logs to the console, and you should see a page view fire.

    HTL and a clientlib
  6. Build the AEM reports

    Author activity deserves its own report suite. A useful starting set: uploads and publishes over time, top downloaded assets, share links opened versus created, and a DAM storage quota stacked bar per folder.

    The two DAM storage quota panel types exist specifically for the scheduler's output, so point them at asset_disk_usage_report.

    Console

Queries worth having on day one

Run these against your own ClickHouse. Each one answers a question that is genuinely hard to answer inside AEM.

-- Assets that were uploaded and published but never downloaded or viewed.
-- Usually the single biggest source of recoverable DAM storage.
WITH
    uploaded AS (
        SELECT
            custom_dimensions['asset_path'] AS asset_path,
            min(event_time)                 AS uploaded_at,
            max(custom_metrics['asset_size_bytes']) AS size_bytes
        FROM website_events
        WHERE event_type = 'asset_upload'
          AND event_date >= today() - 365
        GROUP BY asset_path
    ),
    used AS (
        SELECT DISTINCT custom_dimensions['asset_path'] AS asset_path
        FROM website_events
        WHERE event_type IN ('asset_download', 'asset_share')
          AND event_date >= today() - 365
    )
SELECT
    u.asset_path,
    u.uploaded_at,
    formatReadableSize(u.size_bytes)      AS size,
    dateDiff('day', u.uploaded_at, now()) AS age_days
FROM uploaded AS u
LEFT ANTI JOIN used AS d ON u.asset_path = d.asset_path
WHERE u.size_bytes > 1024 * 1024        -- ignore anything under 1 MB
ORDER BY u.size_bytes DESC
LIMIT 100;

The logs that explain the numbers

Everything above produces counts. Counts raise questions they cannot answer: the upload trend fell off a cliff at 02:00 — was that one author pod, a failing workflow, or nobody working that night? The answer lives in a log line, so the same deployment can ship its log streams to a Grafana Loki server and you read them in the same console.

On AEM this is unusually cheap to add, because the bundle is already installed. aem-infralytiqs-integrator.all embeds aem-loki-integrator.core — the analytics integrator logs through that facade — so if you have deployed the analytics half you already have the forwarder sitting dormant on the instance. Switching it on is an OSGi configuration file, not another dependency in your build.

It is worth more on AEM as a Cloud Service than it is anywhere else. You cannot open a shell on a pod, error.log is per-replica, and replicas are replaced without warning — so the log you want is routinely on an instance that no longer exists by the time you go looking. Streaming the lines somewhere you keep them removes that whole class of problem.

Turning on log shipping

The same run-mode layout as the analytics configuration, under your own project. The full property reference is on the Logs Collector page.

// ui.config/src/main/content/jcr_root/apps/acme/osgiconfig/config.author/
//   com.adobexp.aem.loki.LogbackLokiBootstrap.cfg.json
//
// Author is where the events on this page originate -- workflows, DAM
// processing, replication -- so this is the tier whose logs you
// actually need when an asset report looks wrong.
{
  "url": "https://loki.acme.internal/loki/api/v1/push",
  "username": "aem",
  "password": "$[secret:LOKI_PASSWORD]",

  // Keep these aligned with the analytics tenant. Using the same app
  // name in both systems is what lets you move between a report and
  // its logs without translating identifiers in your head.
  "labels": [
    "app=ACME-DAM",
    "environment=$[env:AEM_ENVIRONMENT;default=LOCAL]",
    "tier=Author",
    "host=${HOSTNAME}",
    "level=%level"
  ],

  "loggers": [
    "com.adobexp.infralytiqs:DEBUG",
    "com.acme.dam:DEBUG",
    "com.day.cq.dam:INFO",
    "com.adobe.granite.workflow:INFO",
    "com.day.cq.replication:INFO"
  ],

  // The facade catches bundles that log through com.adobexp.log.
  // The tailer catches everything else Logback writes -- which on
  // author is most of what you want during an incident.
  "facadeEnabled": true,
  "tailerEnabled": true,
  "logFiles": ["error.log"]
}

Reading AEM logs in the console

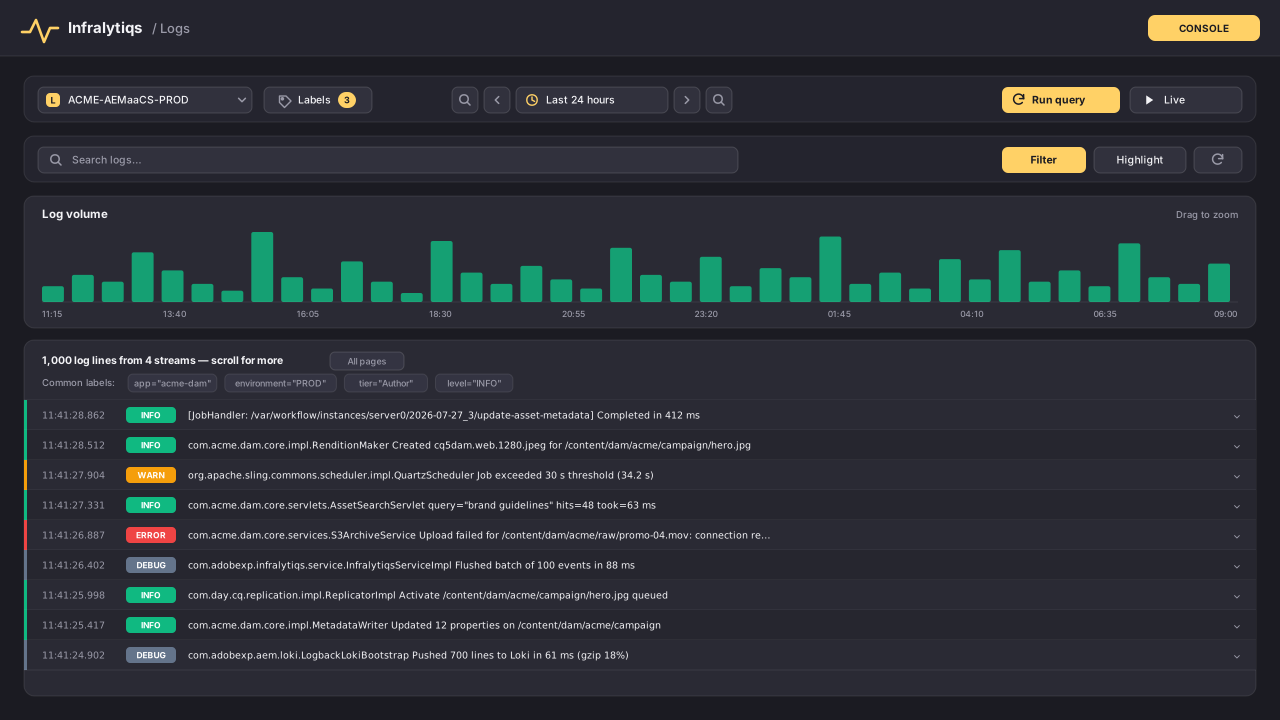
Same console as your asset and storage reports, at /#/infralytiqs/logs.

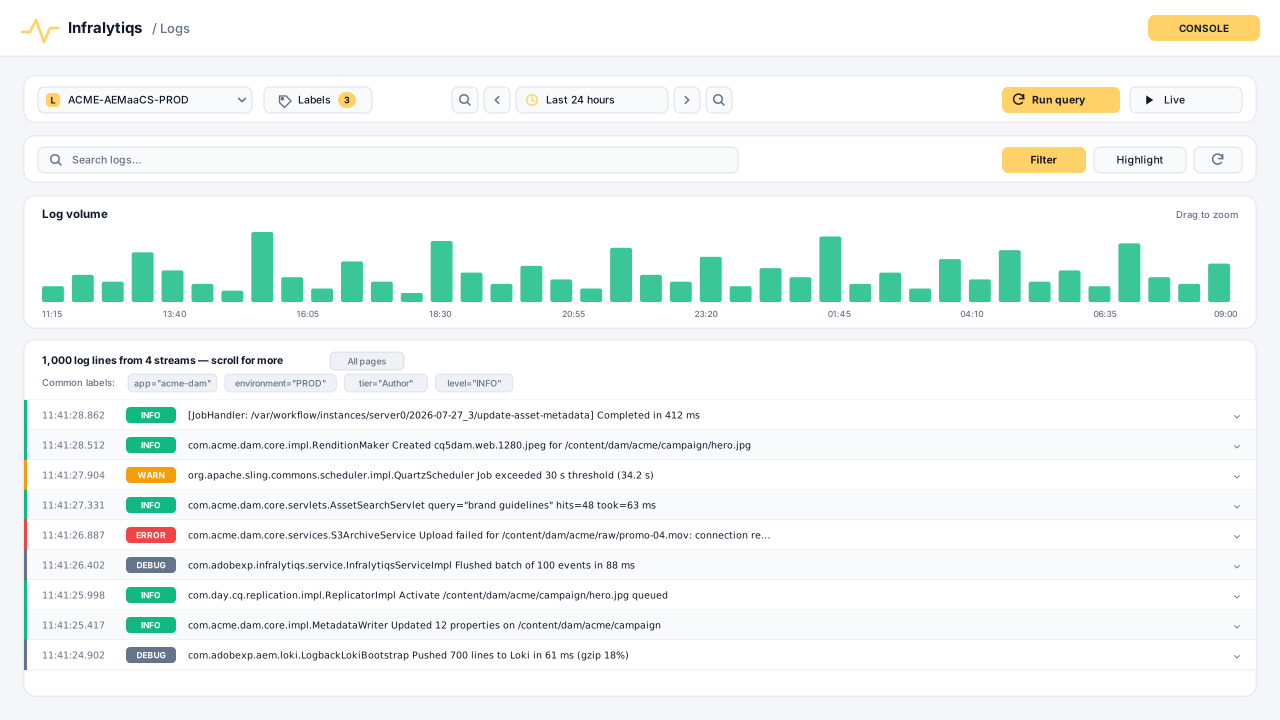
The Infralytiqs logs console showing AEM author log lines with a volume histogram and stream labels The Infralytiqs logs console showing AEM author log lines with a volume histogram and stream labels
Logs page

Author and publish streams

Once both run-mode configurations are deployed you have two tiers of one application in a single view. The volume histogram is drag-to-zoom, which during an incident is usually how you find the minute that matters rather than typing timestamps.

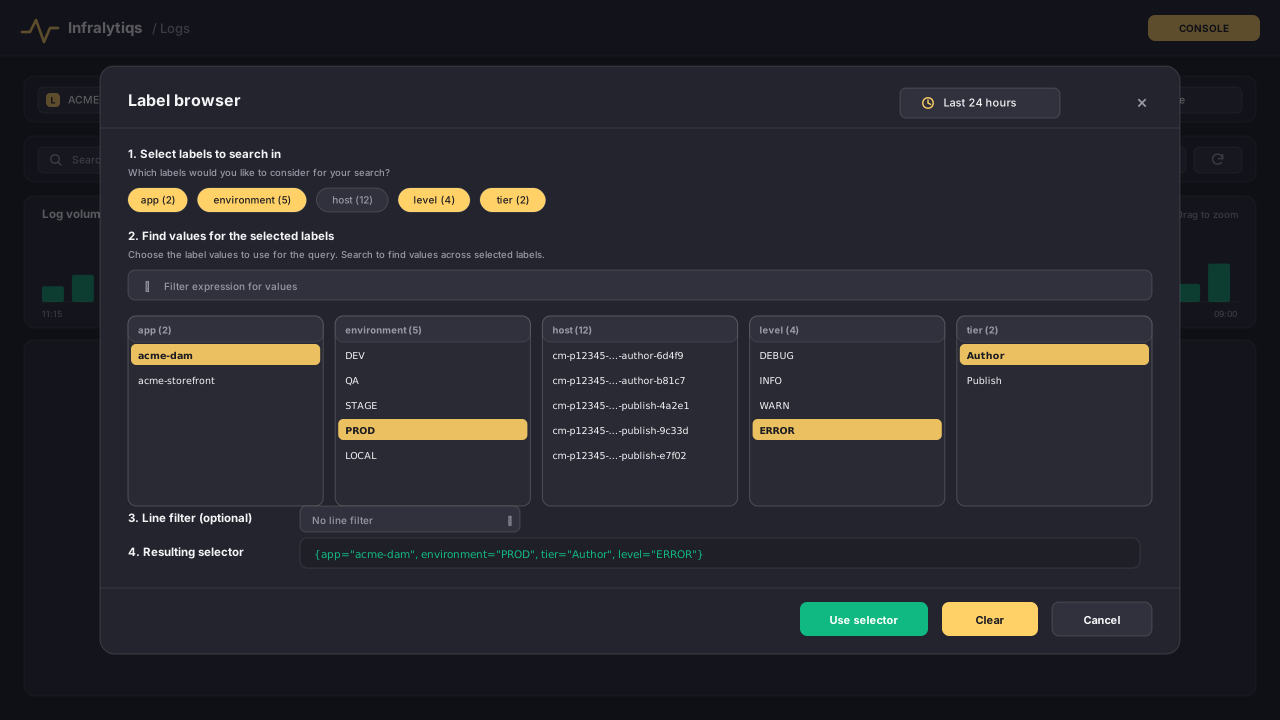
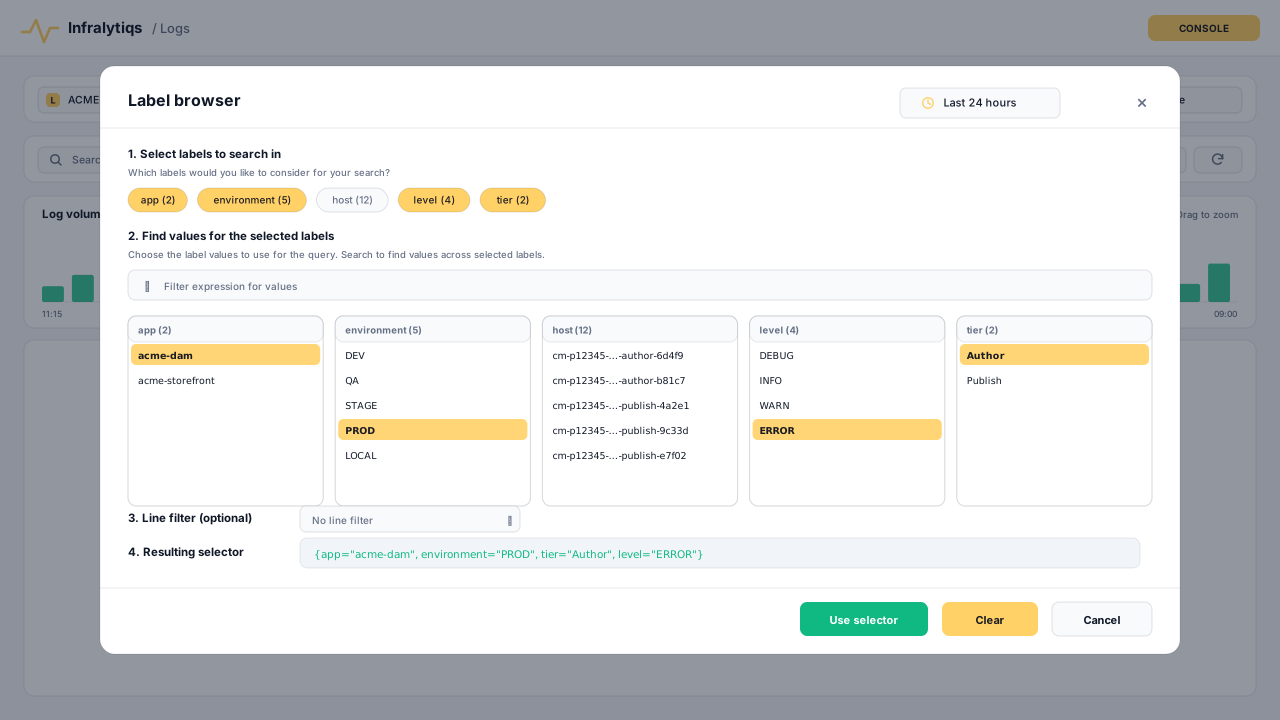
The Infralytiqs label browser showing AEM app, environment, host, level and tier labels The Infralytiqs label browser showing AEM app, environment, host, level and tier labels
Label browser

Narrowing to one pod

The host label carries the AEMaaCS pod name, so “is this one replica or all of them?” is a two-click question. Expect the host list to be long — pods are replaced constantly, and every one that has logged in the window appears.

Going from a report to its logs

The two systems share vocabulary on purpose. These are the joins that come up most.

You are looking at In the report In the Logs page
Uploads stalled overnight asset_upload trend, grouped by hour {app="ACME-DAM", tier="Author", level=~"ERROR WARN"} over the same window
One asset behaving oddly Drill-down filtered on the asset_path dimension {app="ACME-DAM", tier="Author"} = "/content/dam/acme/hero.jpg" — works because resourcePath is in the line
One author’s activity User drill-down on user_id {app="ACME-DAM", tier="Author"} = "jane.doe", assuming hashUserId is off on author
A publish spike after a deploy Page views or downloads by hour {app="ACME-DAM", tier="Publish", level="ERROR"}, then group by host to see whether it is estate-wide
DAM storage growing unexpectedly asset_disk_usage_report by folder_path {app="ACME-DAM", tier="Author"} = "RenditionMaker" — runaway renditions are the usual cause

Things worth deciding before you deploy

Each of these is easier to get right now than to unpick later.

Whether author identities belong in events

Profile enrichment resolves email and display name from JCR, which is genuinely useful and also personal data in a table you keep for two years. Turn it off and you still get an opaque user id. Decide deliberately rather than by default.

One tenant or one per brand

Factory configurations key on content root, so several brands can share one tenant with different site ids, or have a tenant each. Shared makes cross-brand reporting trivial; separate gives you a hard boundary. Both are one configuration file.

When the DAM scan runs

Walking a large DAM is not free. Schedule it off business hours, and remember nothing about a storage trend needs to be real-time. Nightly is almost always right.

That the queue is deliberately lossy

A full backlog drops events and logs it, rather than slowing AEM down. That is the correct trade for analytics — but it means a sustained burst can lose data, so watch the logs after a bulk migration.

Keeping author traffic out of site metrics

The HTL fragment suppresses itself in edit and preview mode. Keep that guard: an author previewing a page all afternoon should not appear as engaged published-site traffic.

A consistent asset_id dimension

It is MATERIALIZED into its own column, so it is the cheapest possible way to join author activity to published performance. Set it the same way on both sides from the start.

AEM-specific questions

The bundle is a standard OSGi bundle using Sling filters, a JCR event listener and the Sling scheduler, so it works on 6.5 on premise as well. The difference is deployment: on Cloud Service it goes through your Cloud Manager pipeline and secrets come from environment variables, while on 6.5 you install the package and manage configuration yourself.
It is designed not to. Filters do minimal work on the request thread and enqueue to an in-memory backlog; the HTTP posts and the JCR profile lookups happen on separate worker threads. When the backlog fills, events are dropped rather than made to wait, precisely so that analytics can never become an availability problem for authors.
Not currently. The author-side instrumentation is asset-centric — uploads, downloads, share link views, replication and DAM storage — plus authentication. Page-level publishing shows up when the replication payload includes assets, but there is no workflow step tracking. Page behaviour is covered from the published side by the browser SDK.
You write it and deploy it as a clientlib in your own project — the integrator ships no ui.apps module, deliberately, because the site-specific hooks are yours. Register its path per host in infralytiqsClientBootstrapLibs, the HTL fragment renders that as window.IL_CLIENT_BOOTSTRAP_LIB, and the SDK injects it. The file on this page is a complete working starting point.
Yes, and it composes well. Subscribe to cmp:click and other data layer events in your bootstrap and forward them with Infralytiqs.track, which gives you Core Components instrumentation without writing selectors. The evarMap in the sample already leans on data-cmp attributes for the same reason.
Health checks never execute JavaScript, so they do not reach the collector at all. Bots that do run JavaScript are classified into device_type = 'bot' by the SDK, so exclude that value in your report filters rather than trying to block them at ingest — keeping the rows means you can always check what you excluded.
Posts fail and are logged, and the backlog drains as capacity allows. Author operations are unaffected, since nothing in the request path waits on the collector. Egress rules are the usual culprit on Cloud Service, so confirm your environment can reach the collector host before assuming a configuration problem.

Wire up the published side too

The website guide covers the browser SDK in full: SPA route changes, identifying users, consent handling and the complete configuration surface.