Ship AEM and application logs into a Grafana Loki server you run, then read them in the same console as your analytics.
Analytics tells you what. Logs tell you why.
A report showing asset downloads collapsing at 02:00 is a question, not an answer. The answer is usually in a log line. The Logs Collector closes that gap: an OSGi bundle forwards log events from AEM into a Grafana Loki server, and the Infralytiqs console gives you a query interface over it — label browser, time range, live tail — next to the reports built from the same deployment.
Two things are worth stating up front. Loki is yours: the collector pushes to a URL you configure, on infrastructure you run, and your log content is never proxied through anything you do not control. And the bundle is inert until you configure it — the forwarder declares ConfigurationPolicy.REQUIRE, so installing the package with no OSGi configuration present does precisely nothing. That is deliberate: turning on log shipping should be an explicit act.
How a log line reaches the console
Four hops, none of which leave infrastructure you own.
Emit
🅰
AEM Author
Workflows · DAM · Sling
Author-tier activity
◈
AEM Publish
Request handling
Publish-tier activity
⚙
Services
Spring Boot · ETL
Any Loki client
Collect
⇉
Facade tee
com.adobexp.log
In-process, no file I/O
☷
File tailer
error.log
Optional, off by default
Ship
⌗
Batcher
700 lines / 9 s
Ring buffer, drop-oldest
↑
Push API
/loki/api/v1/push
Basic auth · gzip
Read
⌸
Loki
Streams by label
Your server, your retention
◉
Console
Label browser · LogQL
Live tail · histogram
The forwarder batches in memory and pushes over HTTP. If Loki is unreachable the queue drops its oldest entries rather than blocking the thread that emitted the log — logging must never take an application down.
Reading logs in the console
The Logs page sits at /#/infralytiqs/logs, alongside your reports and settings.
console.infralytiqs.com/#/infralytiqs/logs
Logs page
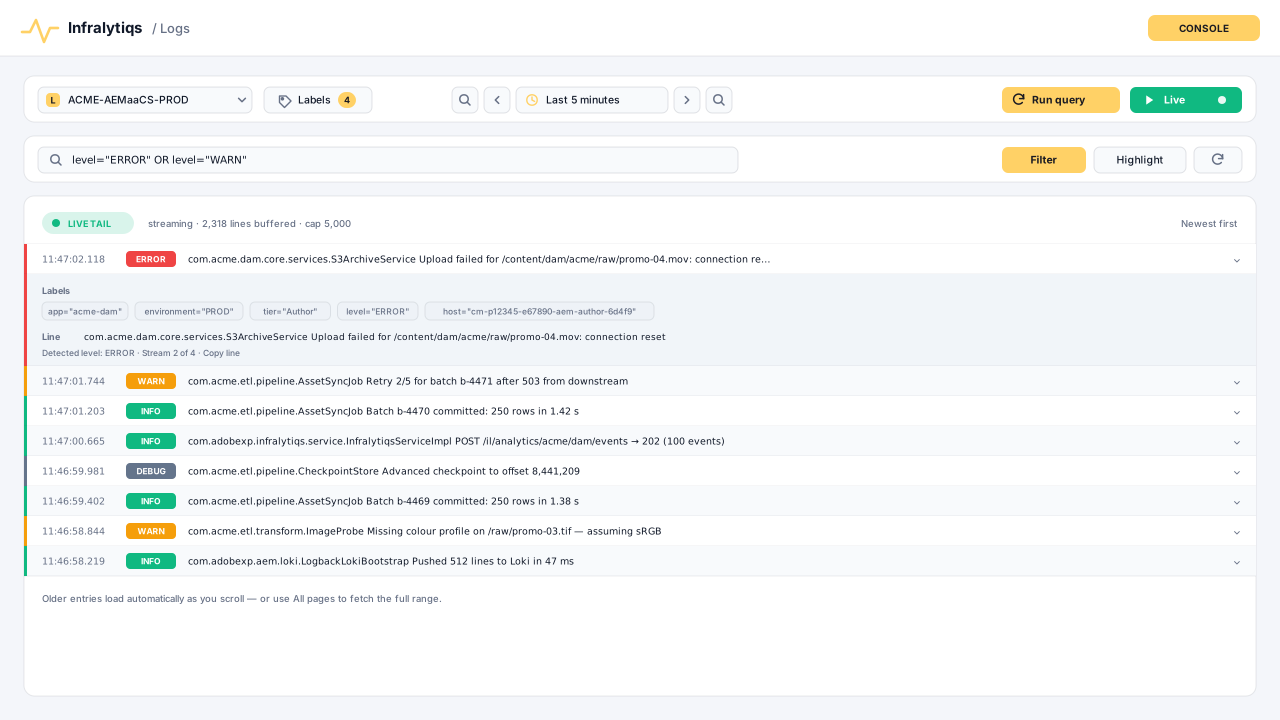
Query results
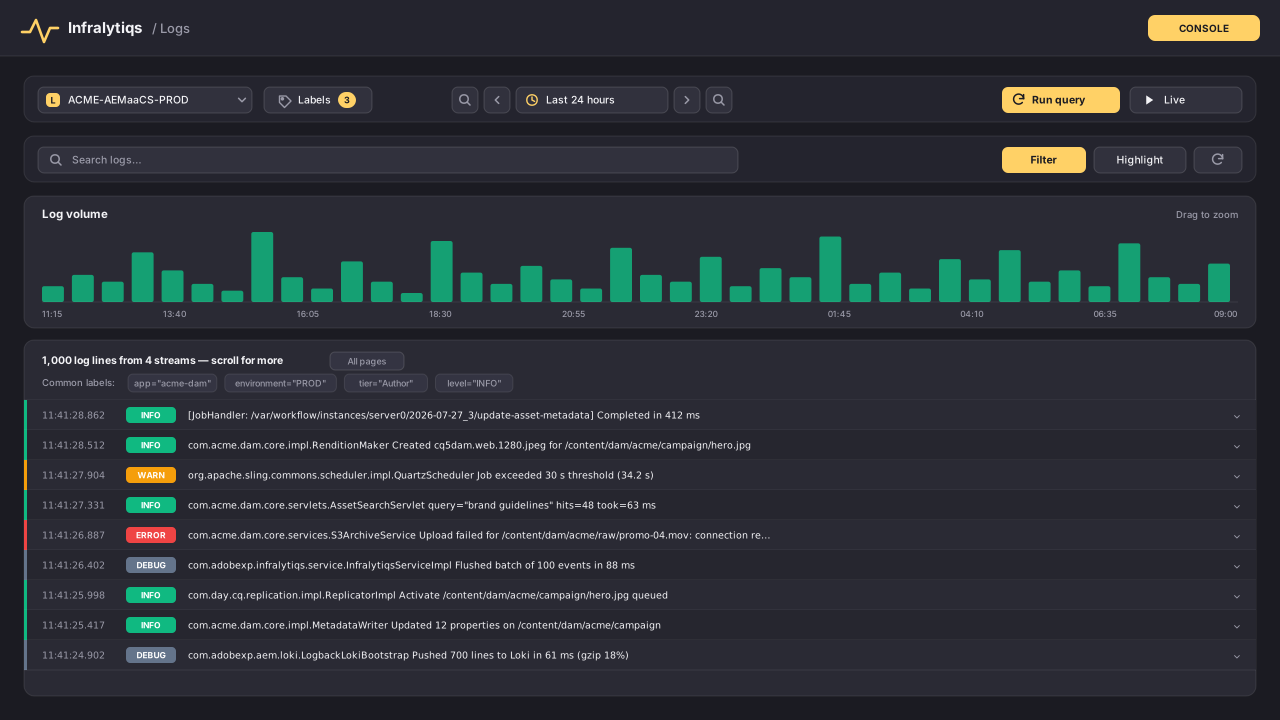
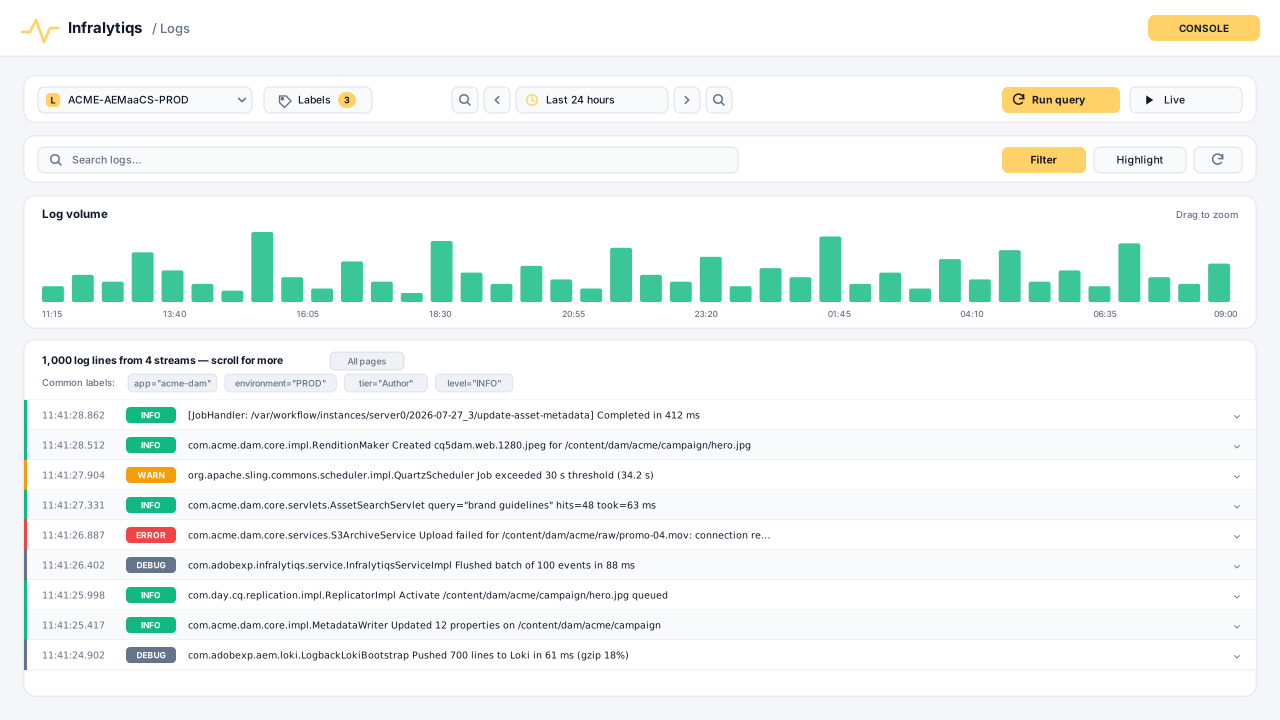
Pick a Loki server, choose a time range and run the query. The volume histogram above the results is drag-to-zoom, so you narrow to the interesting minute by dragging across the spike rather than guessing timestamps. Results stream in pages of 1,000 lines.
Label browser — build a stream selector
Query builder
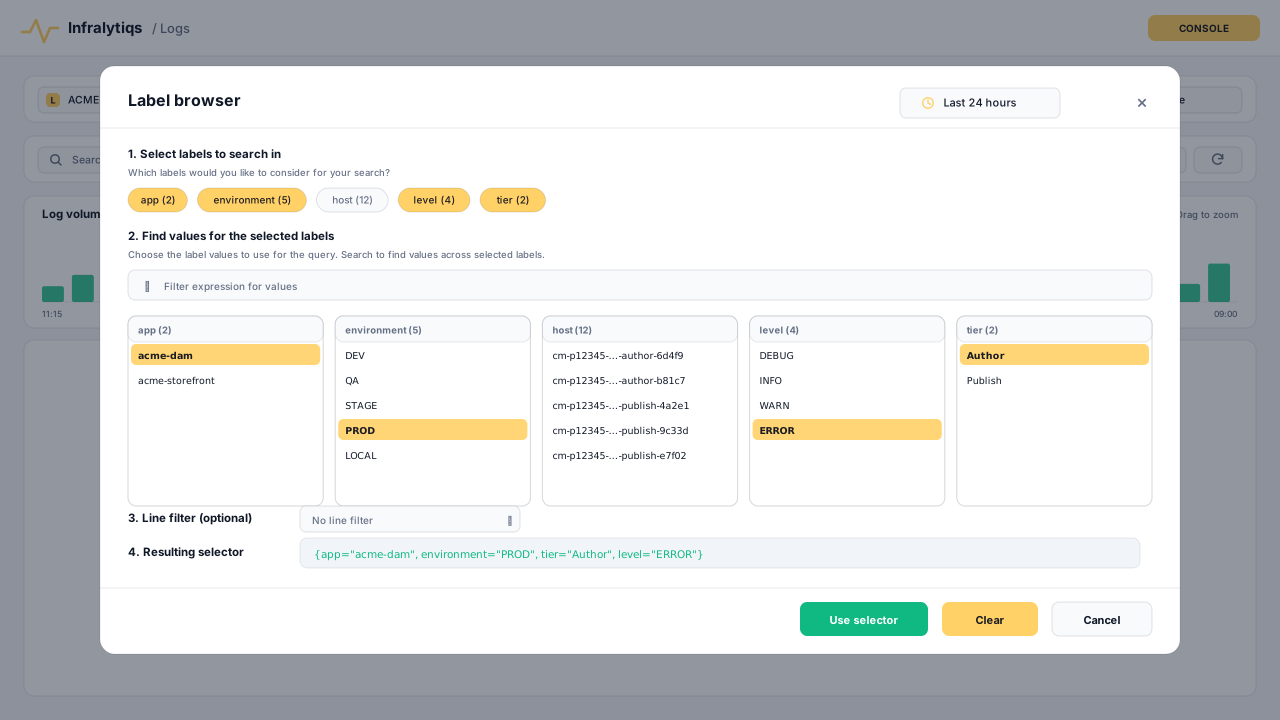
Label browser
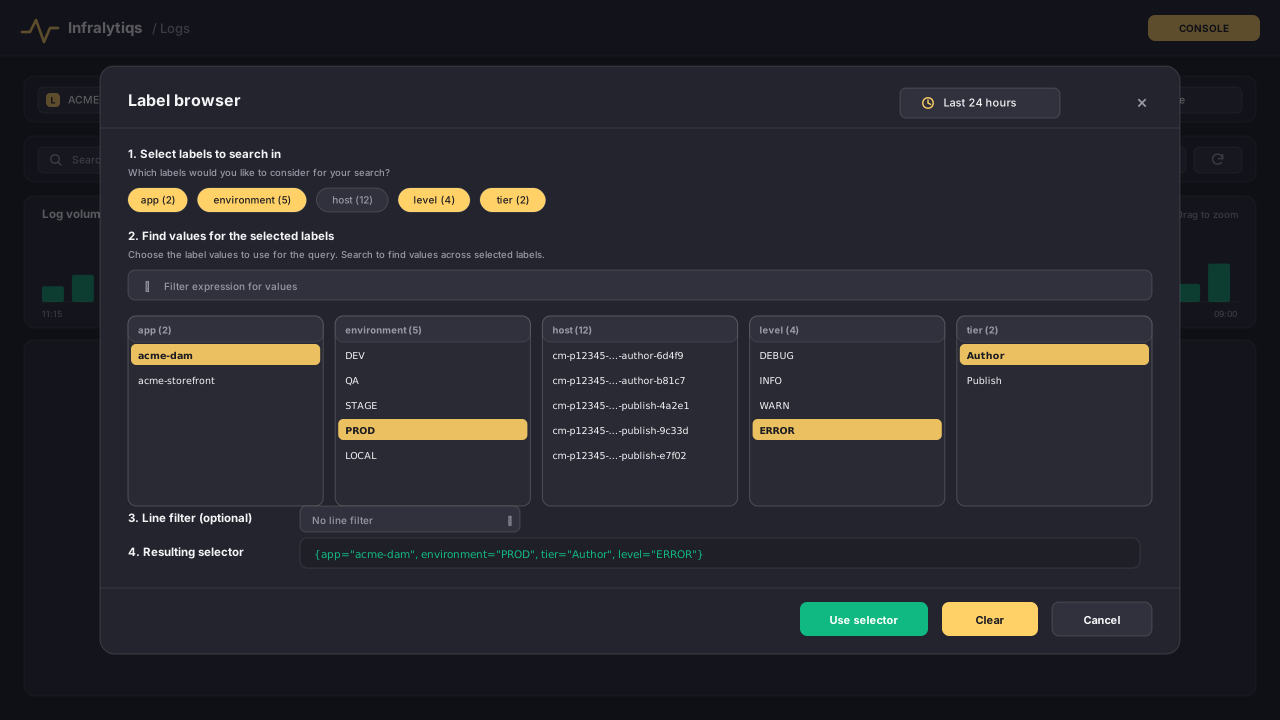
You do not have to write LogQL. The label browser lists every label the selected server has seen in the current time range, with a value count beside each one, and assembles the stream selector as you click. The resulting selector is shown in full so you can copy it or learn the syntax from it.
Live tail — newest first
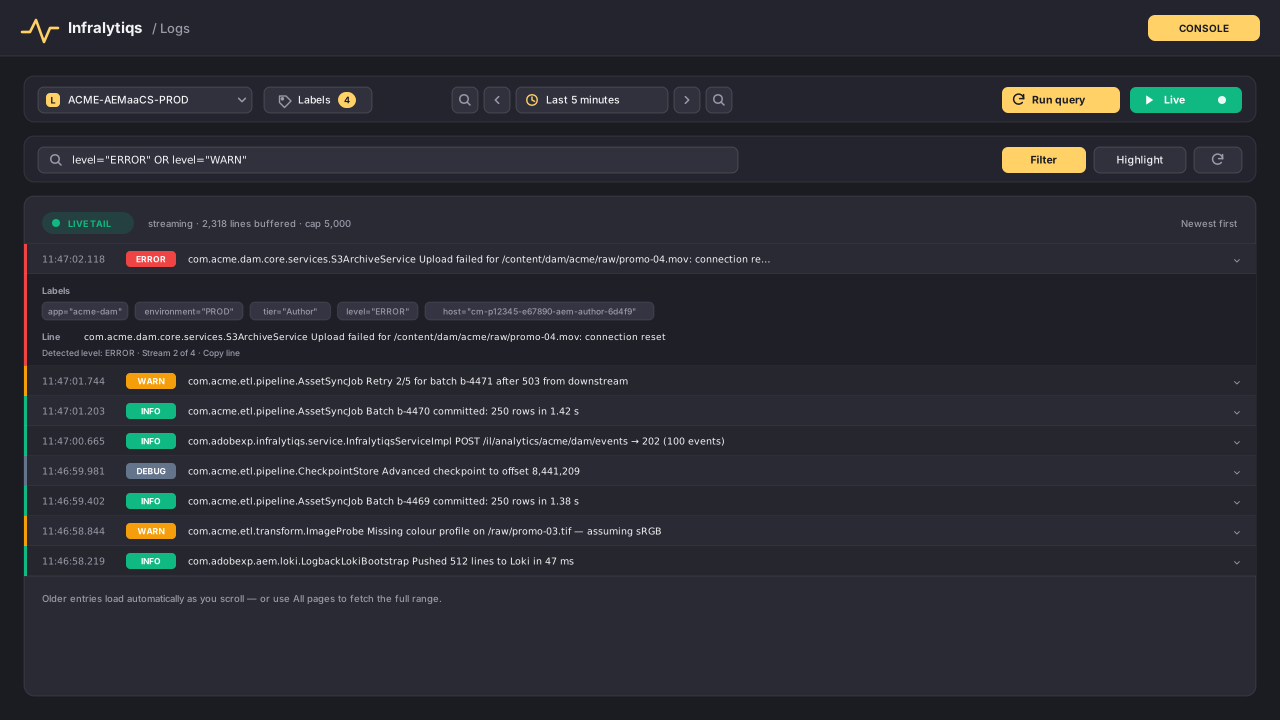
Streaming
Live tail
Live mode polls for newer entries and prepends them, buffering up to 5,000 lines before it starts discarding the oldest. Expanding an entry shows the full line plus every label on its stream — which is how you find out which pod produced it.
Labels are the index — spend them carefully
Loki does not index log content. It indexes labels, and every distinct combination of label values creates a separate stream. That single fact drives every sensible decision about configuring the collector.
Good labels are things you filter by and that have small, bounded value sets: which application, which environment, which tier, which severity. The shipped defaults are exactly that — app, environment, tier, host and level. Bad labels are things with unbounded values: a request id, a user id, an asset path. Put those in the log line, where Loki will happily grep them, and leave them out of the label set.
The one label to think twice about is host. On AEM as a Cloud Service pods are replaced constantly, so host accumulates values over time — a browser showing 45 hosts over 24 hours is normal. It is worth keeping because “is this one pod or all of them?” is a question you will ask during an incident, but it is the label most likely to need pruning if your Loki instance starts complaining about stream cardinality.
Forwarder configuration
Every property on com.adobexp.aem.loki.LogbackLokiBootstrap. The component stays dormant until this configuration exists.
Property
Type
Default
What it does
url
String
http://localhost:3100/loki/api/v1/push
Full Loki push URL. Leave it empty and the forwarder stays dormant
username
String
—
HTTP Basic username. Empty means no Authorization header is sent
// .../osgiconfig/config.author/
//   com.adobexp.aem.loki.LogbackLokiBootstrap.cfg.json
//
// Author is where workflows, DAM processing and authoring activity
// live, so it is worth tailing error.log as well as the facade: that
// picks up third-party loggers you cannot route through the facade.
{
  "url": "https://loki.acme.internal/loki/api/v1/push",
  "username": "aem",
  "password": "$[secret:LOKI_PASSWORD]",

  "labels": [
    "app=ACME-DAM",
    "environment=$[env:AEM_ENVIRONMENT;default=LOCAL]",
    "tier=Author",
    "host=${HOSTNAME}",
    "level=%level"
  ],

  "loggers": [
    "com.acme.dam:DEBUG",
    "com.day.cq.dam:INFO",
    "com.adobe.granite.workflow:INFO"
  ],

  "tailerEnabled": true,
  "logFiles": ["error.log"],
  "tailIntervalMs": 500
}
// .../osgiconfig/config.publish/
//   com.adobexp.aem.loki.LogbackLokiBootstrap.cfg.json
//
// Publish runs many more pods than author and serves far more
// requests, so the level floor is higher and the batch is larger.
// Shipping DEBUG from every publish pod is how you fill a disk.
{
  "url": "https://loki.acme.internal/loki/api/v1/push",
  "username": "aem",
  "password": "$[secret:LOKI_PASSWORD]",

  "labels": [
    "app=ACME-DAM",
    "environment=$[env:AEM_ENVIRONMENT;default=LOCAL]",
    "tier=Publish",
    "host=${HOSTNAME}",
    "level=%level"
  ],

  "loggers": [
    "com.acme.dam:WARN",
    "com.adobexp.infralytiqs:WARN"
  ],

  "batchMaxItems": 1000,
  "batchTimeoutMs": 5000,
  "tailerEnabled": false
}
// .../osgiconfig/config/
//   com.adobexp.aem.loki.LokiMdcFilter.cfg.json
//
// This is the piece that makes logs correlatable. The filter puts a
// per-request id, the user, the session and the resource path into
// SLF4J's MDC, so every line emitted while handling one request can
// be tied back to it -- reference them with %X{requestID} in
// messagePattern, or promote one to a label if it is low-cardinality.
{
  "enabled": true,

  "requestIdKey": "requestID",
  "resourcePathKey": "resourcePath",
  "resourcePathMaxLength": 256,

  "userIdKey": "userID",

  // On publish, pseudonymise. hashUserId keeps lines joinable without
  // writing the actual principal into your log store.
  "hashUserId": true,
  "skipAnonymous": true,

  "sessionIdKey": "sessionID",
  "sessionIdSource": "both"
}
Standing it up, end to end
From an empty project to a query in the console.
1
Run a Loki server
Loki is a single Go binary and a storage backend. For an evaluation, grafana/loki in a container with filesystem storage is enough. For production, put it behind TLS with basic auth and give it object storage — the collector authenticates with a username and password, so anything that terminates Basic auth in front of Loki will work.
Note the push URL. It is the value of url and it must include the full path, /loki/api/v1/push.
Prerequisite
2
Add the bundle to your build
Add com.adobexp.loki:aem-loki-integrator.all to your all package as an embedded sub-package. It installs the core bundle to /apps/aem-loki-integrator-packages/application/install/ and nothing else — no configuration, no content.
If you are also deploying the Infralytiqs analytics integrator, you already have this: aem-infralytiqs-integrator.all embeds the same core bundle, because the analytics integrator logs through the com.adobexp.log facade.
Maven
3
Deploy the OSGi configuration
Put the configurations above under /apps/<your-project>/osgiconfig/, split by runmode. Keep the credentials in Cloud Manager secrets and reference them with $[secret:NAME] rather than committing them.
This is the step that switches the forwarder on. Until a configuration for com.adobexp.aem.loki.LogbackLokiBootstrap exists, the component is not satisfied and no log line leaves the instance.
Your project
4
Verify the component is active
Open /system/console/components?filter=com.adobexp.aem.loki. LogbackLokiBootstrap should be active, not unsatisfied. Unsatisfied almost always means the configuration landed in a runmode folder that is not applied on the instance you are looking at.
Set verbose to true temporarily and you will get a push confirmation and a periodic heartbeat with batch counts in error.log — the fastest way to tell shipping from silence. Turn it off once you are satisfied.
Web console
5
Register the server in the console
In the console go to Infralytiqs → Settings and add a module of type Loki: a display name, the Loki query base URL and its credentials. This is the read path and it is separate from the push URL the AEM bundle uses — they are frequently different hosts.
Use Test connection before saving. It calls the label endpoint and tells you immediately whether the URL and credentials are right, which is much less painful than discovering it from an empty result set later.
Infralytiqs
6
Query it
Open Infralytiqs → Logs, pick the server you just registered, set a time range and press Run query. With no selector you get everything the server has in that window, which is the right way to confirm data is arriving.
Then open the Labels browser and narrow down. If the label list is empty, the server is reachable but has no data in the selected range — widen the range before you go looking for a configuration problem.
Logs page
What the Logs page gives you
The Logs page is deliberately not a general-purpose Grafana. It does the handful of things you actually do when something is wrong, and it does them without making you leave the console your reports live in.
A time range that behaves. Quick ranges from the last 5 minutes to the last 2 years, an absolute picker showing your browser timezone, and shift-back / shift-forward / zoom-out controls so you can walk a window across an incident rather than retyping timestamps.
A volume histogram. Bars above the results show line counts over the window, and you drag across them to zoom. During an incident this is normally how you find the minute that matters.
Search that does not re-query. The search box filters the lines already fetched, with a Filter mode that hides non-matching lines and a Highlight mode that keeps them and marks the hits. Highlight is the one you want when you need surrounding context.
Level colouring you did not configure. Severity is derived from the level or severity stream label, so ERROR lines are visually distinct as soon as your label set includes one of them.
Paging and live tail. A query returns up to 1,000 lines; scrolling fetches the next page by walking backwards from the oldest entry you already have, and All pages pulls the whole range. Live mode polls forward instead, keeping up to 5,000 lines buffered.
The console log API
Everything the Logs page does is available over HTTP, scoped to a registered Loki module by its config id.
Endpoint
Body / query
Returns
GET /il/logs/loki-labels/:configId
start, end (epoch ms)
Label names present in the window
POST /il/logs/loki-label-values/:configId
label, selectedLabels, start, end
Values for one label, narrowed by any labels already chosen
POST /il/logs/loki-series/:configId
selectedLabels, start, end
The series map behind the label browser
POST /il/logs/loki-query-range/:configId
query (LogQL), start, end, limit (default 1000), direction (default backward)
Loki query_range response, proxied through unchanged
POST /il/settings/loki-test-connection
An unsaved module configuration
Whether the URL and credentials work — used by Test connection
Selectors worth keeping
The label browser writes these for you, but they are worth being able to read.
# Everything from one application on one tier in production.
{app="ACME-DAM", environment="PROD", tier="Author"}

# Errors and warnings only. A regex match on a label is still an
# index lookup, so this stays cheap.
{app="ACME-DAM", environment="PROD", level=~"ERROR|WARN"}

# One pod, when you suspect a single instance is misbehaving.
{app="ACME-DAM", host="cm-p12345-e67890-aem-author-6d4f9"}

# Both tiers at once -- useful when you are following a replication
# problem across the author/publish boundary.
{app="ACME-DAM", environment="PROD", tier=~"Author|Publish"}
# Label matchers narrow the streams; line filters scan what is left.
# Always put the tightest label selector you can in front.
{app="ACME-DAM", environment="PROD"} |= "S3ArchiveService"

# Exclude the noise rather than enumerating the signal.
{app="ACME-DAM", tier="Author"} != "health-check"

# Regex, for when one substring will not do.
{app="ACME-DAM"} |~ "(?i)timeout|connection reset|circuit ?breaker"

# Chained: narrow, then narrow again. Filters apply left to right.
{app="ACME-DAM", level="ERROR"}
  |= "/content/dam/acme/campaign"
  != "RenditionMaker"
# Error rate per pod over five-minute buckets -- the query behind
# "is it one node or all of them?".
sum by (host) (
  rate({app="ACME-DAM", environment="PROD", level="ERROR"}[5m])
)

# Errors by tier, to see whether a deploy hit author or publish.
sum by (tier) (
  count_over_time({app="ACME-DAM", level="ERROR"}[15m])
)

# Workflow completions per minute, pulled out of the line itself.
sum(
  count_over_time(
    {app="ACME-DAM", tier="Author"} |= "JobHandler" |= "Completed" [1m]
  )
)
-- The two halves answer different questions about the same minute.
-- Start in ClickHouse: when did asset downloads stop?
SELECT
    toStartOfMinute(event_timestamp) AS minute,
    count()                          AS downloads
FROM website_events
WHERE event_type = 'asset_download'
  AND event_timestamp >= now() - INTERVAL 2 HOUR
GROUP BY minute
ORDER BY minute;

-- Then take the minute the count fell off and, in the Logs page,
-- set an absolute range around it with:
--
--   {app="ACME-DAM", environment="PROD", level=~"ERROR|WARN"}
--
-- Both views are keyed on wall-clock time in the same deployment,
-- which is the whole reason for putting them in one console.
Request context: the MDC filter
A Sling filter that stamps per-request identifiers into the MDC so lines from one request can be tied together. It is optional, and unlike the forwarder it is active with defaults as soon as the bundle is installed.
Property
Default
What it does
enabled
true
Master switch for the filter
requestIdKey
requestID
MDC key for a generated 16-character correlation id, unique per request
userIdKey
userID
MDC key for the requesting user. Blank to skip entirely
hashUserId
false
Write the first 12 hex characters of the SHA-256 instead of the principal. Worth turning on for publish
skipAnonymous
false
Omit the user id for anonymous requests rather than recording anonymous repeatedly
sessionIdKey
sessionID
MDC key for the session id
sessionIdSource
http
Where the session id comes from: http, resolver or both
resourcePathKey
resourcePath
MDC key holding the request URI
resourcePathMaxLength
256
Truncation limit for the resource path, so a pathological URL cannot bloat every line
Questions that come up
No. The AEM bundle pushes directly to the Loki server you name in the OSGi configuration, and the console reads from the Loki server you register in Settings. Infralytiqs proxies the read query so the browser is not holding your Loki credentials, but the log content is stored only by you, under whatever retention you configure on Loki itself.
The forwarder keeps an in-memory queue sized at four times the batch limit, or 1,024 entries, whichever is larger. When it fills, the oldest entry is dropped and a counter increments. That is a deliberate trade: log shipping degrades rather than blocking the thread that emitted the line. Loki being down should never be able to take AEM down with it.
Not in the 3.x line. There are two sources. The facade tees events from bundles that log through com.adobexp.log, in process, while still delegating to SLF4J so lines keep appearing in error.log. The optional file tailer reads AEM log files from disk and parses the standard layout, which is how you capture third-party loggers you do not control. Turning tailerEnabled on is the general-purpose answer; the facade is the low-overhead one.
Yes, for any logger that reaches both. The facade sees a bundle's own events and the tailer sees whatever Logback wrote to the file, so a logger routed through both is shipped twice. Either narrow loggers so the facade covers only your own packages, or run the tailer alone and accept the file-parsing round trip.
The push is asynchronous and batched — 700 lines or 9 seconds, whichever comes first — on a separate thread, and the body is gzipped when that actually makes it smaller. The cost on the request thread is an enqueue. The real cost is in Loki's storage and your retention policy, both of which are yours to size.
Yes, and you do not need this bundle for it. Anything that can POST to /loki/api/v1/push can write to the same server — Promtail, Grafana Alloy, the Loki client libraries, or a handful of lines of your own. Use the same app / environment / tier label convention and the console will browse it alongside the AEM streams. The server-side analytics page walks through exactly this for a Spring Boot service.
Almost always because the selected time range contains no data. Loki answers label queries for a window, not for all time, so a quiet overnight period legitimately returns nothing. Widen the range to the last 24 hours before assuming the configuration is wrong.
Logs and analytics from the same deployment
The AEMaaCS integration wires up both halves at once — asset and storage analytics from AEM, and the log streams that explain them.